
The National Health Security Preparedness Index measures the nation’s health security and preparedness—that is, the nation’s ability to prepare for, respond to, and recover from large-scale health threats. The Preparedness Index measures health security from a broad, multi-sectoral perspective using nearly 140 measures from more than 50 different sources. Here we examine three of these measures: paid time off (PTO), telecommuting, and high-speed internet access from home, in the context of health security, preparedness, and equity. These factors have at least three things in common: they enhance compliance with social distancing policies used in infectious disease outbreaks; they highlight the private-sector role in the nation’s health preparedness; and they bring to the fore important equity issues. For prime working-age adults between 25 and 54 years old, an estimated 81 percent have broadband access at home, approximately 62 percent have some form of PTO, and about 30 percent can telecommute when they are away from their usual workplace. However, there are significant differences based on income and education levels, with individuals at lower income and education levels reporting lower percentages of PTO, broadband access, and telecommuting. Our analysis of individual-level U.S. Census data reveals statistically significant independent effects of education and income on whether an individual has PTO, broadband at home, or can telecommute. This analysis illustrates how the less advantaged can be affected differently by disease outbreaks, disasters, and large-scale emergencies—and how workplace practices can either exacerbate or ameliorate health security.
Rationale
Social distancing policies, such as school closures and self-quarantine measures, were used during the 2014 Ebola outbreak and the 2009 H1N1 influenza (flu) pandemic to thwart the spread of disease. The efficacy of this approach, however, is largely determined by the extent to which individuals adhere to it. The Centers for Disease Control and Prevention (CDC) estimates that almost 18 of the 26 million H1N1 infected workers in the fall of 2009 took days off from work, but the remaining 8 million workers did not and likely infected another 7 million co-workers.[1]
Broadband access facilitates the continuity of operations during emergencies that can limit the adverse economic impact of disasters. There was, for instance, a citywide closure of Boston after the 2013 Marathon bombing, but some businesses stayed open with teleworkers and experienced limited financial losses. Similarly, health department staff were able to work remotely to maintain critical communications and surveillance activities.
These three factors—PTO, telecommuting, and high-speed internet access from home—can enhance the likelihood individuals will adhere to social distancing and quarantine measures.[2] PTO and telecommuting are two of 17 item measures within the Preparedness Index domain of Countermeasure Management.[3] PTO is an indicator of preparedness and resilience, because it enables one to shelter in place or evacuate during an emergency without experiencing the economic hardship of lost income. Likewise, the ability to telecommute and household access to high-speed internet are vital because, like PTO, if one can work at home, remain economically productive, and shelter in place, it enhances individual security and community resilience.[4] Also, as one of 13 measures in the Incident & Information Management domain,[5] household broadband access reflects the degree to which one can receive timely and up-to-date information during a public health emergency. The Pew Research Center reports that four in ten Americans often get their news online, highlighting the reliance on the internet for staying informed.[6]
Factors Affecting PTO, Telecommuting, & Household Broadband Access
Based on our analysis of prime working age adults from 25 to 54 years old, an estimated 62 percent of workers have some form of PTO,[7] about 30 percent can telecommute when away from their usual workplace,[8] and an estimated 81 percent of households have broadband in the home.[9] However, there are significant differences based on income and education levels, with individuals at lower income and education levels showing comparatively lower percentages.
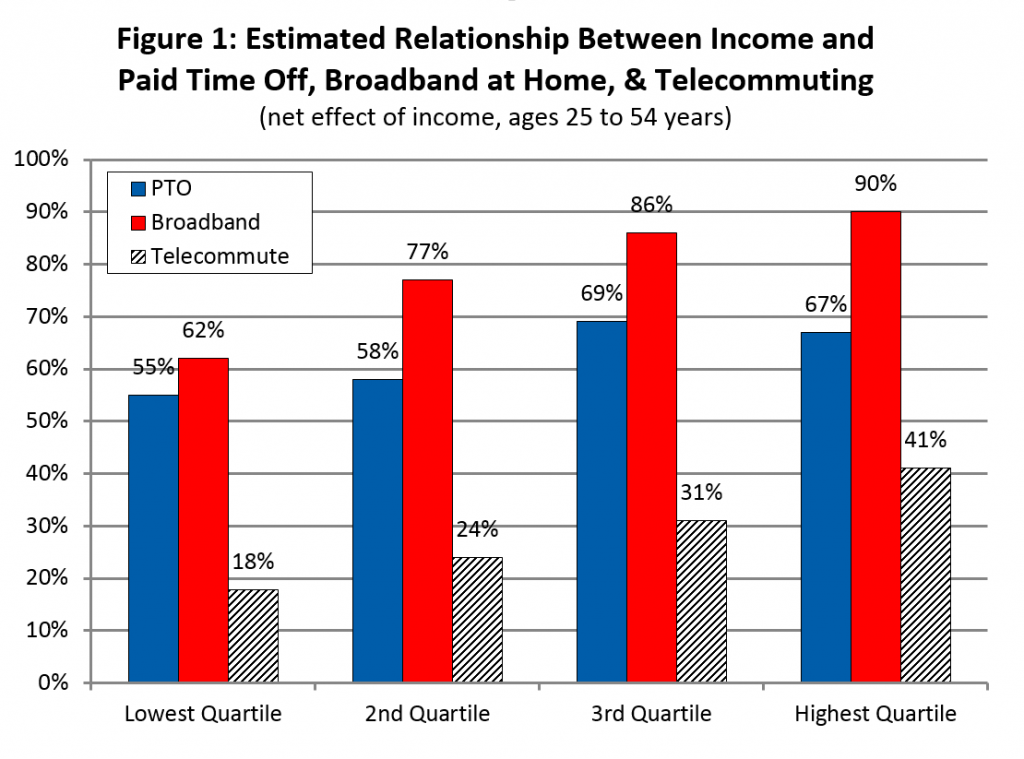
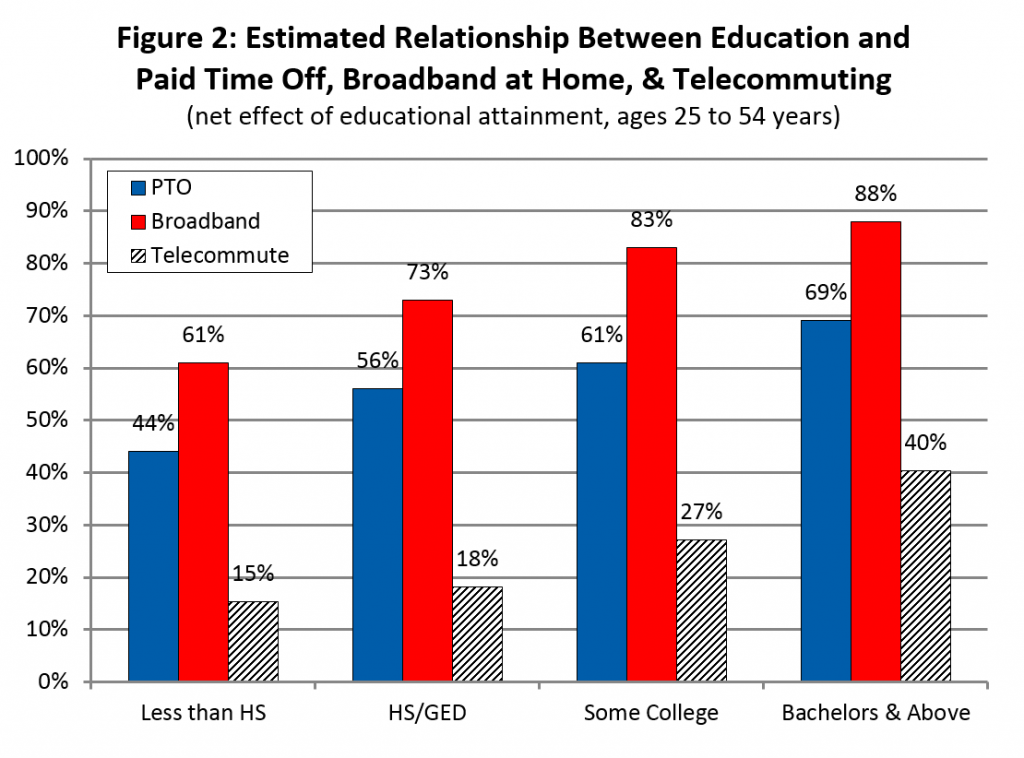
The numbers in Table 1 illustrate some of the significant differences in these factors across income and education levels. The “gross” numbers, explained in detail below, represent the overall percentages for everyone in that category. We can see, for example, that those without a high school diploma are much less likely to have PTO (33 percent) than those with a bachelor’s degree or higher (70 percent), and workers in the lowest income group (25 percent) are much less likely to have PTO than those in the highest income group (73 percent).
TABLE 1—ESTIMATED GROSS AND NET PERCENTAGE OF WORKERS (25 TO 54 YEARS) WITH PAID TIME OFF, HOUSEHOLDS WITH BROADBAND, AND TELECOMMUTERS |
||||||
| Paid Time Off | Household Broadband | Telecommuters | ||||
| Wages & Salary | Gross | Net | Gross | Net | Gross | Net |
| 1st Quartile (lowest) | 25% | 55% | 58% | 62% | 12% | 18% |
| 2nd Quartile | 58% | 58% | 76% | 77% | 20% | 24% |
| 3rd Quartile | 71% | 69% | 88% | 86% | 32% | 31% |
| 4th Quartile (highest) | 73% | 67% | 95% | 90% | 47% | 41% |
| Education | ||||||
| Less than High School | 33% | 44% | 55% | 61% | 9% | 15% |
| High School | 53% | 56% | 70% | 73% | 15% | 18% |
| Some College | 52% | 61% | 83% | 83% | 25% | 27% |
| Bachelors or Higher | 70% | 69% | 93% | 88% | 44% | 40% |
| Race | ||||||
| White (non-Hispanic) | 57% | 61% | 83% | 81% | 31% | 30% |
| Non-White (non-Hispanic) | 55% | 59% | 74% | 77% | 26% | 30% |
| Residence | ||||||
| Non-Metro | 54% | 60% | 76% | 78% | 19% | 25% |
| Metro | 58% | 61% | 81% | 81% | 31% | 30% |
| Age | ||||||
| Under 40 | 58% | 58% | 81% | 81% | 30% | 31% |
| Over 40 | 65% | 64% | 81% | 80% | 29% | 29% |
| Gender | ||||||
| Female | 55% | 58% | 80% | 81% | 26% | 26% |
| Male | 59% | 63% | 81% | 80% | 34% | 34% |
Similarly, individuals with higher income and education levels are more likely to have household broadband and are more likely to telecommute. Individuals, for instance, in the highest income quartile are 1.6 times more likely to have household broadband (95 percent) than those in the lowest income quartile (58 percent)—and are four times more likely to telecommute (46.8 percent compared to 11.7 percent). Likewise, there are big differences across education levels. Those with a bachelor’s degree or higher are 1.7 times more likely to have household broadband (93 percent) than those without a high school diploma (55 percent)—and are 4.9 times more likely to telecommute (44.2 percent compared to 9.1 percent).
Within each of the education and income groups described above, the individuals and households might be quite different from each other and only share membership in the group on the basis of that one factor. That is, among those with a bachelor’s degree or higher there will be members from every income group, both genders, many ages, and all races and ethnicities. We call these the “gross” percentages. However, because so many factors are correlated—like income, education, race, gender, and location of residence—the gross differences do not reveal how much of a digital divide, for example, is due to income (because higher education is associated with higher income), education (since lower income is correlated with lower education), or location of residence (since individuals in metro areas tend to have higher income and educational attainment).
To better address the equity issues represented by the gross differences described above, it is necessary to isolate and identify the “net” differences. Multiple regression analysis allows us to assess the independent or net effects of these factors.[10] The net effect is an estimate of how individuals and households differ along a single dimension while holding all other factors constant. For example, comparing two individuals with the same education, race, age, gender, and residence—but from different income groups—allows us to estimate the effect of income on whether one has PTO, telecommutes, or has household broadband access. Knowing whether the root cause of the inequity is primarily due to a lack of income, education, or where someone lives can suggest whether the best public policy approach might be subsidizing internet access, launching an information campaign explaining the benefits of broadband, or providing the last mile of wired infrastructure.
The differences in the “net” percentages across income and education groups are significant and important (see Figures 1 and 2). Someone with a bachelor’s degree is nearly 1.6 times more likely to have PTO (69 percent v. 44 percent), more than 1.4 times more likely to have high-speed internet at home (88 percent v. 61 percent), and about 2.6 times more likely to telecommute (40 percent v. 15 percent), assuming all other factors ceteris paribus, compared to the lowest education category, and we see similar patterns across the income quartiles.
Discussion
Inequality—in both opportunity and outcome—is becoming the defining zeitgeist of our era. We typically think about inequality in the context of income, but equity and health also go hand-in-hand. Alonzo Plough, PhD, MPH, chief science officer and vice president of Research, Evaluation, and Learning at the Robert Wood Johnson Foundation, for example, recently described how extreme weather events can have a disproportionate impact on “children, the elderly, people with chronic health conditions, the economically marginalized and communities of color.”[11] And others have raised concerns about the disproportionate vulnerability of lower-income Americans to the Zika virus.[12] While there are many ways in which this relationship can manifest itself, research and analysis confirm what common sense suggests: the less-advantaged are affected differently by disease outbreaks, disasters, and large-scale emergencies.
We illustrate here how lower levels of education and income are associated with a decreased likelihood (both in terms of gross and net percentages) that one will enjoy the benefits of PTO, have household broadband access, or telecommute. Understanding the root causes of these differences and addressing the inequities will enhance health security, preparedness, and community resilience. However, understanding the root causes is not sufficient—community leaders from the private, public, and nonprofit sectors must work together to tackle the root causes of these inequities. By doing so, the health security of the entire community will be enhanced.
Michael T. Childress is a research associate at the Center for Business and Economic Research, Gatton College of Business and Economics, at the University of Kentucky. He is part of the program management office for the National Health Security Preparedness Index.
_______
[1] Robert Drago and Kevin Miller, “Sick at Work: Infected Employees in the Workplace During the H1N1 Pandemic,” Institute For Women’s Policy Research Briefing Paper, IWPR No. B264, February 2010.
[2] See Anne M. Kavanagh and James E. Fielding, “Leave entitlements, time off work and the household financial impacts of quarantine compliance during an H1N1 outbreak,” BMC Infectious Diseases (2012).
[3] Countermeasure management includes several measures that account for programs, products, and systems necessary to be prepared for, protected from, and resilient against chemical, biological, radiological, nuclear, and explosives (CBRNE) agents and emerging infectious disease threats.
[4] Susan Cutter, et al., “The geographies of community disaster resilience,” Global Environmental Change 29 (2014), pp. 65-77.
[5] Incident & Information Management reflects the ability to: mobilize all critical resources from any source; establish and maintain command, control, and coordination structures within the affected community; provide necessary legal, administrative, and logistical support; and exchange multijurisdictional, multidisciplinary public health and medical-related information, intelligence, plans, and situational awareness.
[6] Pew Research Center, Pathways to news, http://www.journalism.org/2016/07/07/pathways-to-news/.
[7] We pool five years of U.S. Census, Current Population Survey, Annual Social and Economic (ASEC) Supplement data (2012-2016) and limit our sample to prime working age adults, 25 to 54 years old. Our estimate of 62 percent is similar to another that uses a different method and data set—the March 2016 Bureau of Labor Statistics National Compensation Survey (NCS). The 2016 NCS data estimates 68 percent of workers have paid sick leave, 73 percent have paid vacation, and 75 percent have paid holidays. For more information on the NCS see Employee Benefits Survey http://www.bls.gov/ncs/ebs/.
[8] These estimates are derived from the U.S. Census, Current Population Survey, July 2015, Computer and Internet Use File, and is estimated from the variable PETELEWK: What about telecommuting, or working while away from (you/his/her) usual workplace? (Do you/Does NAME) use the Internet to telecommute or work while away from (your/his/her) usual workplace? We limit the analysis to prime working age adults, 25 to 54 years old.
[9] We base our estimate and analysis on the U.S. Census, Current Population Survey, July 2015, Computer and Internet Use File. We limit our analysis to heads of household between 25 and 54 years old, the prime working age population.
[10] We use two different, but similar, models for PTO, household broadband, and telecommuting. Both models include dichotomous variables for income quartiles, educational attainment, race, residence, age, and gender. The PTO model also include dichotomous variables for 14 industrial sectors, ranging from agriculture to public administration.
[11] Alonzo L. Plough, “The Impact of Climate Change on Health and Equity,” June 22, 2016, Robert Wood Johnson Foundation http://www.rwjf.org/en/culture-of-health/2016/06/what_does_climatech.html.
[12] Jamila Taylor, “What the Media and Congress Are Missing on Zika and Poverty,” May 24, 2016, https://talkpoverty.org/2016/05/24/media-congress-missing-zika-poverty/.